
Examining PyPI Package Statistics with lxml and pandas
Hello, I’m Scott Burns and I thought I’d share a little hack I put together the other day. I maintain a package on PyPI and was curious about download statistics per version. Since I don’t put out new versions on any sort of a schedule, I needed to normalize the downloads per version per time between each version.
Here’s a quick gameplan:
- As far as I know, there’s no PyPI endpoint to grab uploaded version strings for a package, so we’ll have to scrape a little bit.
- PyPI does provide a nice JSON endpoint (
https://pypi.python.org/pypi/%(package)/%(version)/json) that we can use to grab the upload time and download statistics per version, among other things. - Load up a
pandas.DataFrameand do some quick datetime subtraction and normalization. - Plot.
Getting started
I developed this with the super useful IPython notebook. The guts of this post don’t depend on it, but it simplifies plotting at the end. Let’s install ipython, some third-party stuff used here and boot up:
$ pip install ipython tornado pyzmq
$ pip install numpy
$ pip install pandas lxml requests matplotlib cssselect dateutil
$ ipython notebook
Assuming this goes to plan, a browser window will open where you can start a new notebook. Some initial imports:
from lxml.html import document_fromstring
import requests
import pandas as pd
from dateutil.parser import parse as dateparse
%pylab inline
Scraping PyPI for Package Versions
I’m not aware of a public endpoint on PyPI for grabbing all uploaded versions of a package (and if there is, just skip this section!), so we need to scrape the package edit page to grab this information.
def package_versions(package_name, name_pwd):
    """
    Scrape the package's pkg_edit page for all uploaded versions

    package_name: official package name
    name_pwd: PyPI username, password tuple

    Returns a list of versions for the package
    """
    pl = {':action': 'pkg_edit', 'name': package_name}
    r = requests.get('https://pypi.python.org/pypi', params=pl, auth=name_pwd)
    html = document_fromstring(r.content)
    rows = html.cssselect('table.list tr')[:-1]
    header = rows[0]
    data = rows[1:]
    version_index, _ = filter(lambda x: x[1].text_content().lower() == 'version',
        enumerate(header))[0]
    versions = map(lambda x: x[version_index].text_content(), data)
    return versions
There’s nothing too complex going on here. We’re using the venerable requests library to grab the page using our username and password for basic authentication. Given the page content, we parse it with lxml and then select the table rows (except the last row which contains the Remove and Update Releases buttons that we don’t care about). Then, the header row is filtered for which column contains the text Version so this scraping function won’t break if the columns are re-ordered for whatever reason. Finally, we pull out the version string from each of the rows in the table and return the list.
Since PyPI uses basic authentication, we need to provide our username and password to grab the page. If you use a ~/.pypirc config file, your credentials are stored in the [pypi] section. This function makes it a little bit easier to grab it:
def get_pypi_auth():
    """
    Try to read ~/.pypirc and return the (username, password) tuple
    """
    from ConfigParser import ConfigParser
    import os
    cp = ConfigParser()
    cp.read(os.path.expanduser('~/.pypirc'))
    name = cp.get('pypi', 'username')
    passwd = cp.get('pypi', 'password')
    return name, passwd
Using the Official PyPI JSON Feed
Fortunately, PyPI provides a proper JSON feed for a package’s statistics, so that’s the end of our scraping. Here’s a function to grab the package metadata and download information:
def package_data(package, version):
    """
    Hit the official json feed for a package and version
    """
    url = 'http://pypi.python.org/pypi/%s/%s/json' % (package, version)
    data = requests.get(url).json()
    metadata = data['info']
    # PyPI publishes version information as a list, we're interested in first
    url_info = data['urls'][0]
    return metadata, url_info
Again, nothing too fancy here. Request the page, decode the json and return the two pieces of data. Of note, the urls key in the json feed is a list (of all published versions?), but since we requested the package data for a specific version, we’re OK to just use the first item.
Putting it all together
First, let’s declare the package we’re interested in and grab the versions and package data.
package = 'PyCap'
versions = package_versions(package, get_pypi_auth())
data = [package_data(package, v)[1] for v in versions]
In this example, we only care about the url_info and am throwing away the package metadata in the list comprehension. Given the data, we can make a pandas.DataFrame and start to play around with the downloads and upload_date columns.
df = pd.DataFrame(data, index=versions)
# convert upload_time
df['upload_time'] = df['upload_time'].map(dateparse)
df['elapsed'] = df['upload_time'] - df['upload_time'].shift(-1)
The PyPI feed is giving is proper ISO 8601 formatted date strings, so the dateutil.parser.parse function has no problem converting to proper datetime objects. The df['upload_time'].shift(-1) is a temporary column that as it’s name suggests is shifted, in our case up one row. This new elapsed column is therefore a series of timedelta objects representing the time between when each version was uploaded to PyPI.
We’re almost ready to normalize the downloads per version. We need a numerical value for the amount of days in these timedelta objects, which we can normally get with the read-only .days attribute. However, our shift & subtract above made the last row in the elapsed column a NaN since pandas dutifully propagates NaN values. Therefore, simply mapping the simple lambda x: x.days attribute getter to df['elapsed'] will throw a ValueError, so we have to provide a slightly smarter getter function:
def to_days(x):
    days = -1
    try:
        days = x.days
    except:
        pass
    return days

df['days elapsed'] = df['elapsed'].map(to_days)
# compute downloads / day
df['downloads / day'] = df['downloads'] / df['days elapsed']
Finally, we have our normalized downloads per version per day metric. Obviously, you could also do some average time per version, total number of downloads, etc. given this data. If you’re really feeling adventurous, you might consider joining this table with commit information from Github and figure out on average how long it takes to add (or delete) a single line of code.
Plotting and wrapping up
pandas provides nice hooks into matplotlib for easily plotting columns against the DataFrame’s index. We’ll initialize a figure, plot (leaving out the data from the first version as that value is meaningless) and lightly annotate.
to_plot = df['downloads / day'][:-1]
mpl.rc('figure', figsize=(10, 8))
to_plot.plot(kind='bar')
plt.ylabel('Downloads Per Day')
plt.xlabel('Version')
plt.title('Downloads/day per version for %s' % package)
plt.show()
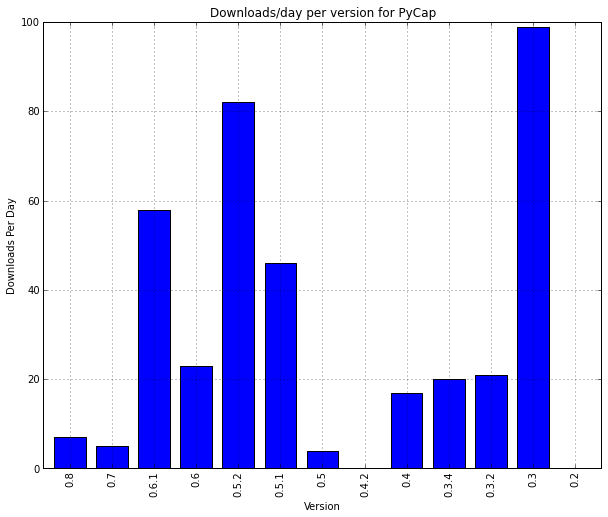
I’ll leave interpretation as an exercise to the reader. If you work with any type of data in python, I highly recommend taking a look at pandas, I’ve only scratched the surface of what it can do here. Personally, I’ve been able to erase lots of ugly data import code and for that alone I’m thankful.
Like I mentioned above, this post was developed in an IPython notebook. It’s posted as a gist here. You can view the rendered version here.